Code
library(terra)
library(sf)
library(ggplot2)
library(knitr)
library(tidyterra)library(terra)
library(sf)
library(ggplot2)
library(knitr)
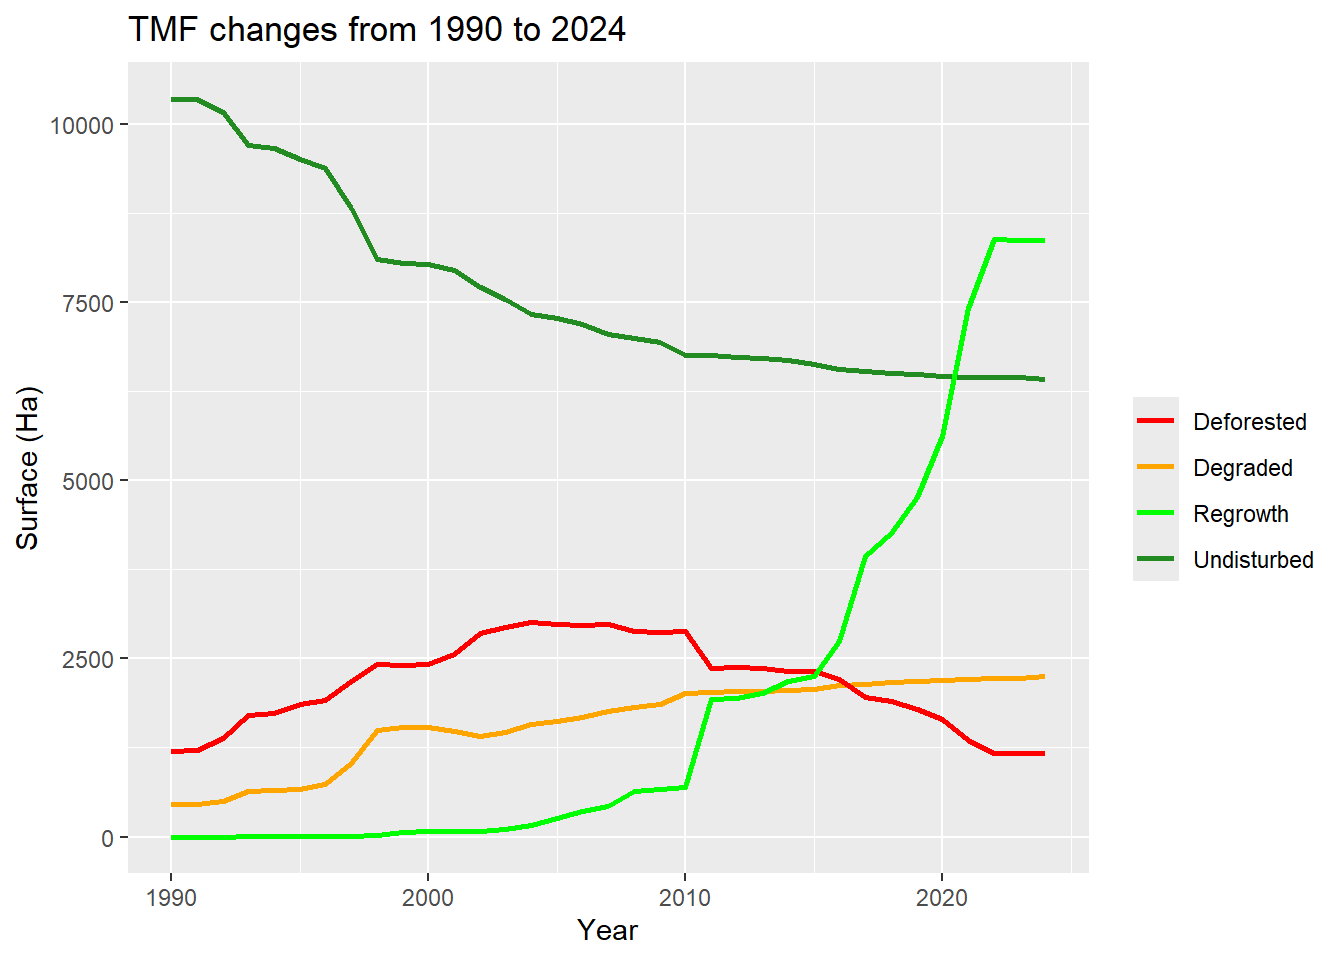
library(tidyterra)We used the Tropical Moist Forest product, developed by the European Commission’s Joint Research Centre. This product, based on Landsat images, classifies forest areas and detects annual changes (including deforestation and forest degradation) from 1990 to 2024 at a resolution of 30 metres.
# download tmf - annual change for luzon between 1990 and 2024
dir_tmf <- "data/tmf"
if (!dir.exists(dir_tmf)) dir.create(dir_tmf)
for (yr in 1990:2024) {
  file <- paste0(
    dir_tmf, "/JRC_TMF_AnnualChange_v1_", yr,
    "_ASI_ID76_N20_E120.tif"
  )
  if (!file.exists(file)) {
    paste0(
      "https://ies-ows.jrc.ec.europa.eu/iforce/tmf_v1/download.py?",
      "type=tile&dataset=AnnualChange_", yr, "&lat=N20&lon=E120"
    ) |>
      download.file(file, mode = "wb")
  }
}tmf_files <- list.files(dir_tmf, pattern = "UMRBPL", full.names = TRUE)
years <- gregexpr("[0-9]+", tmf_files) |>
regmatches(x = tmf_files) |>
lapply(as.numeric) |>
lapply(function(i) i[i > 1900]) |>
unlist()
data <- data.frame(
year = years,
Undisturbed = -1,
Degraded = -1,
Deforested = -1,
Regrowth = -1,
Water = -1,
Other = -1
)
area <- list.files("data/umrbpl/", full.names = TRUE, pattern = "shp$") |>
read_sf() |>
st_transform(crs = "EPSG:4326")
tmf <- tmf_files |>
rast() |>
crop(area) |>
mask(area) |>
lapply(function(r) {
levels(r) <- names(data)
r
}) |>
rast()
names(tmf) <- years
for (i in seq_len(dim(tmf)[3])) {
for (c in 1:6) {
cat_mask <- (tmf[[i]] == c)
n_pixels <- global(cat_mask, fun = "sum", na.rm = TRUE)$sum
surface_ha <- n_pixels * 30 * 30 / 10000
data[i, c + 1] <- surface_ha
}
}tmf_years <- tmf[[which(grepl("2010|2015|2020", names(tmf)))]]
ggplot() +
geom_spatraster(data = tmf_years) +
facet_wrap(~lyr) +
scale_fill_manual(values = c("darkgreen", "orange", "red",
"green", "lightblue", "grey")) +
labs(fill = NULL)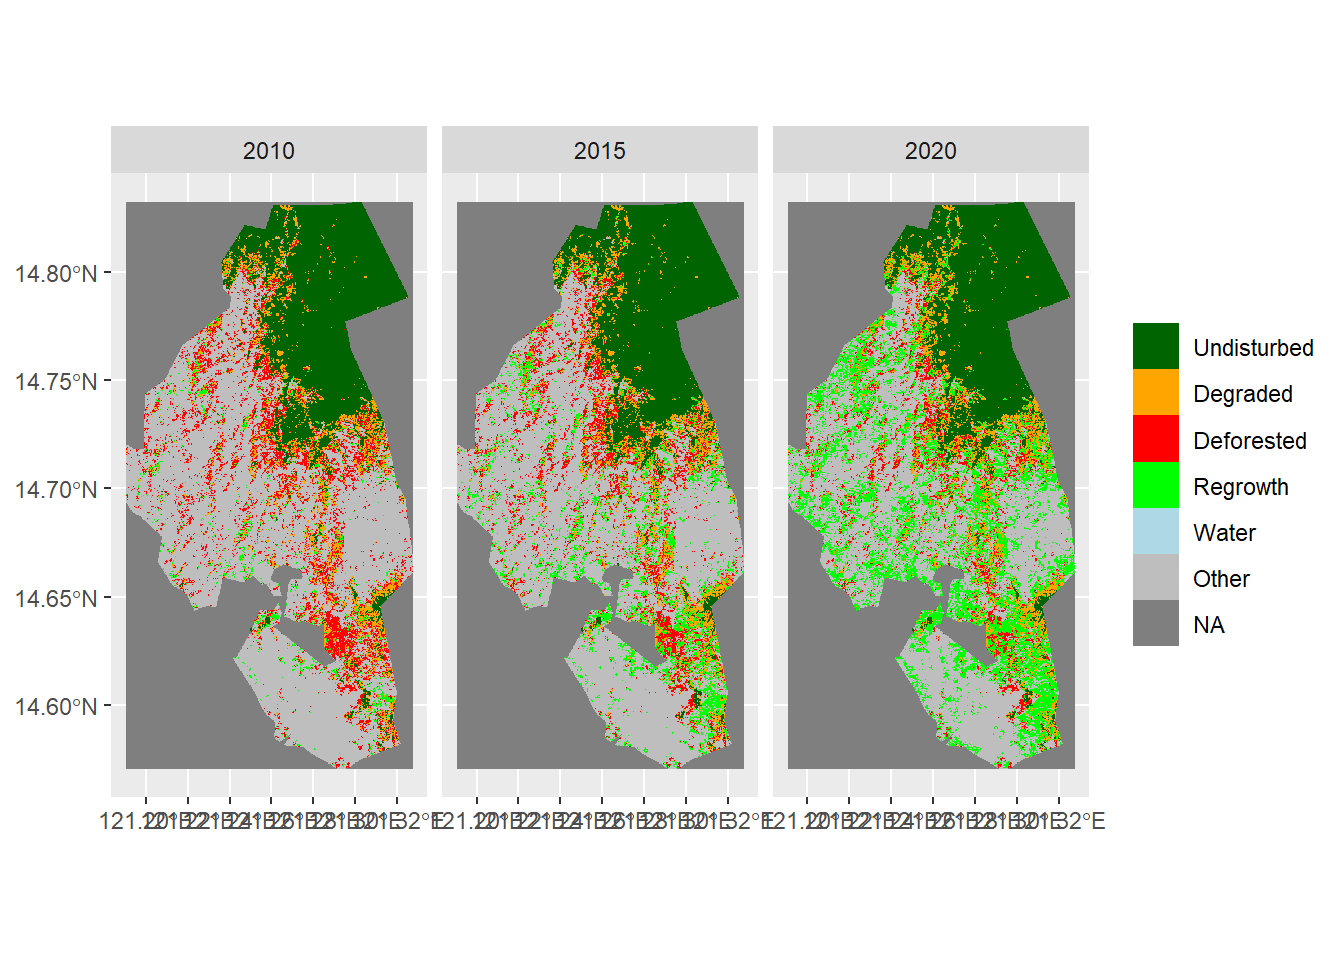
ggplot(data, aes(x = year)) +
  geom_line(aes(y = Undisturbed, color = "Undisturbed"), size = 0.9) +
  geom_line(aes(y = Degraded, color = "Degraded"), size = 0.9) +
  geom_line(aes(y = Deforested, color = "Deforested"), size = 0.9) +
  geom_line(aes(y = Regrowth, color = "Regrowth"), size = 0.9) +
  scale_color_manual(name = "", values = c(
    "Undisturbed" = "forestgreen",
    "Degraded" = "orange",
    "Deforested" = "red",
    "Regrowth" = "green"
  )) +
  labs(title = "TMF changes from 1990 to 2024", x = "Year", y = "Surface (Ha)")