Code
library(sf)
library(terra)
library(ggplot2)library(sf)
library(terra)
library(ggplot2)This dataset was downloaded from Lang, N., Rodríguez, A. C., Schindler, K., & Wegner, J. D. (2021). Canopy top height and indicative high carbon stock maps for Indonesia, Malaysia, and Philippines (Version 1.0) [Data set]. Zenodo. http://doi.org/10.5281/zenodo.5012448
Tree height was estimated by combining Sentinel-2 optical satellite images and GEDI lidar data, using a deep convolutional neural network.
dir_height <- "data/tree_height"
area <- list.files("data/umrbpl/", full.names = TRUE, pattern = "shp$") |>
  read_sf() |>
  st_transform(crs = "EPSG:4326")
if (!dir.exists(dir_height)) dir.create(dir_height)
if (!file.exists(paste0(dir_height, "/canopy_top_height_2020_umrbpl.tif"))) {
  zen4R::download_zenodo(
    "10.5281/zenodo.5012447", dir_height,
    "canopy_top_height_2020_philippines.tif"
  )
  paste0(dir_height, "/canopy_top_height_2020_philippines.tif") |>
    rast() |>
    crop(area) |>
    mask(area) |>
    writeRaster(paste0(dir_height, "/canopy_top_height_2020_umrbpl.tif"))
}tmf <- list.files("data/tmf", "AnnualChange", full.names = TRUE)[1:31] |>
rast() |>
crop(area) |>
mask(area)
height <- rast(paste0(dir_height, "/canopy_top_height_2020_umrbpl.tif")) |>
resample(tmf, method = "average")
# age of secondary forests in 2020
tmf_sec_age <- mask(x = tmf, ifel(tmf[[31]] == 4, 1, NA)) |>
app(\(x) if(any(!is.na(x) & x != 4)) {length(x) - max(which(x !=4))} else NA)
# previous land use
tmf_sec_prev <- mask(x = tmf, ifel(tmf[[31]] == 4, 1, NA)) |>
app(\(x) if(any(!is.na(x) & x != 4)) {x[max(which(x !=4))]} else NA)
# create complete dataframe
df_height <- c(tmf[[31]], height, tmf_sec_age, tmf_sec_prev) |>
as.data.frame() |>
subset(!is.na(Dec2020))
colnames(df_height) <- c("class", "height", "sec_age", "sec_prev")
df_height$class <- factor(df_height$class)
levels(df_height$class) = c("Undisturbed", "Degraded", "Deforested",
"Regrowth", "Water", "Other")df_height |>
ggplot() +
geom_boxplot(aes(x = class, y = height)) +
labs(x = NULL, y = "Canopy height (m)")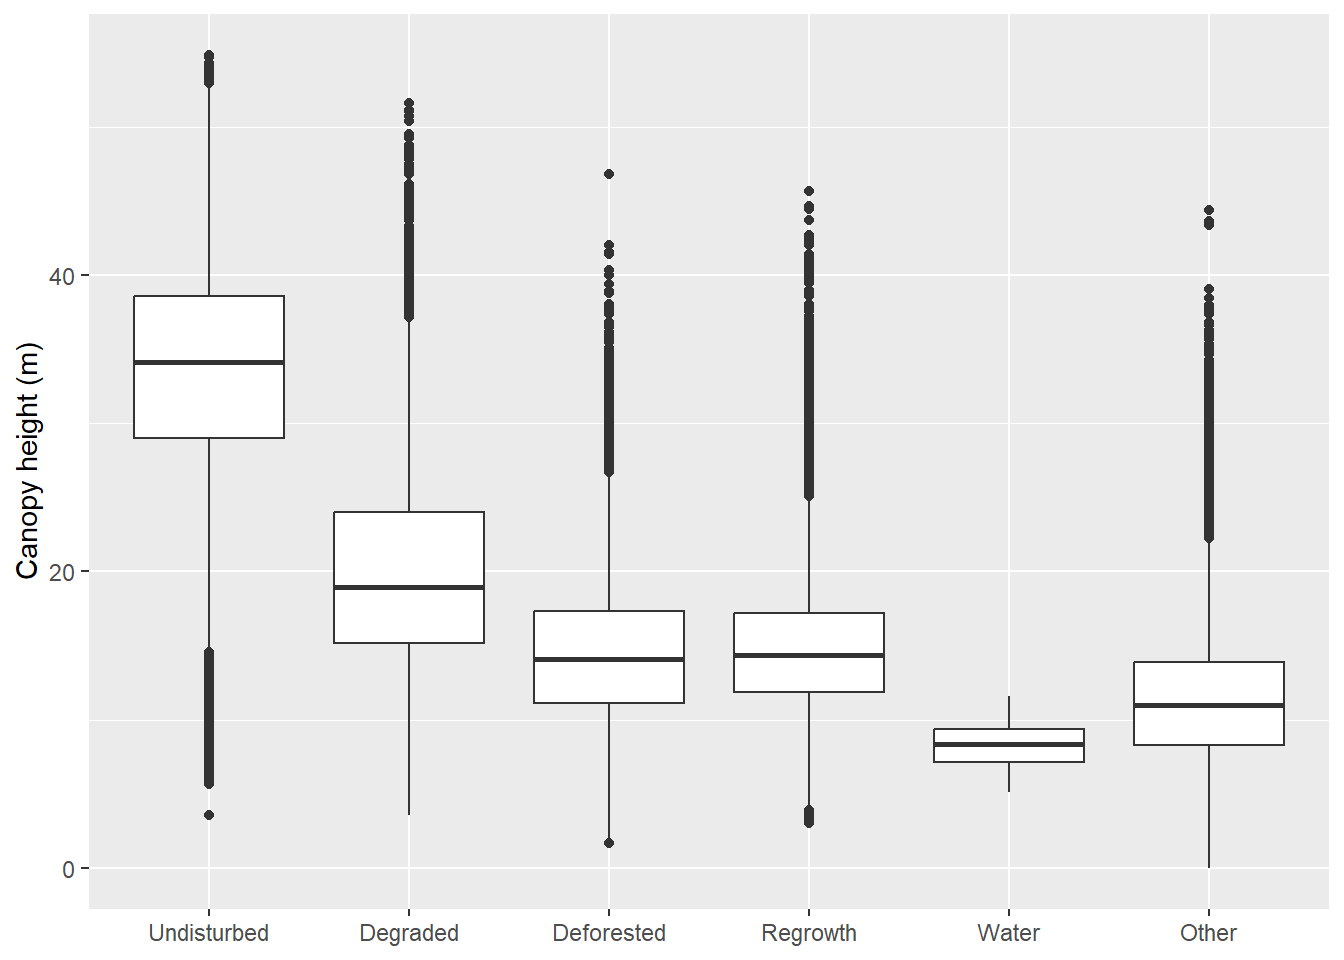
df_height |>
  subset(!is.na(sec_age)) |>
  ggplot() +
  geom_histogram(aes(x = sec_age)) +
  labs(x = "Secondary forest age in 2020 (yr)")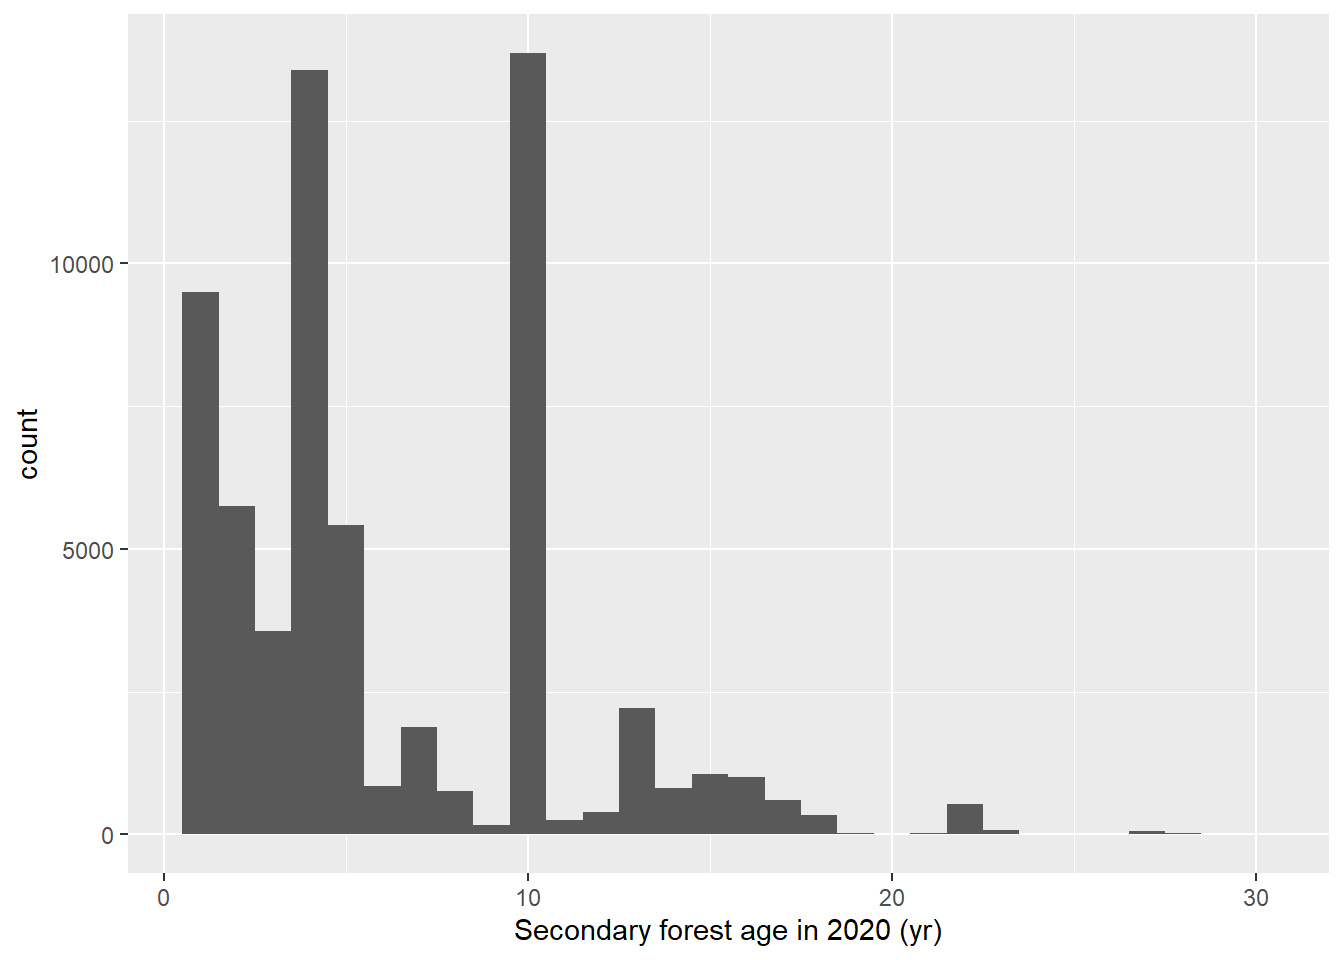
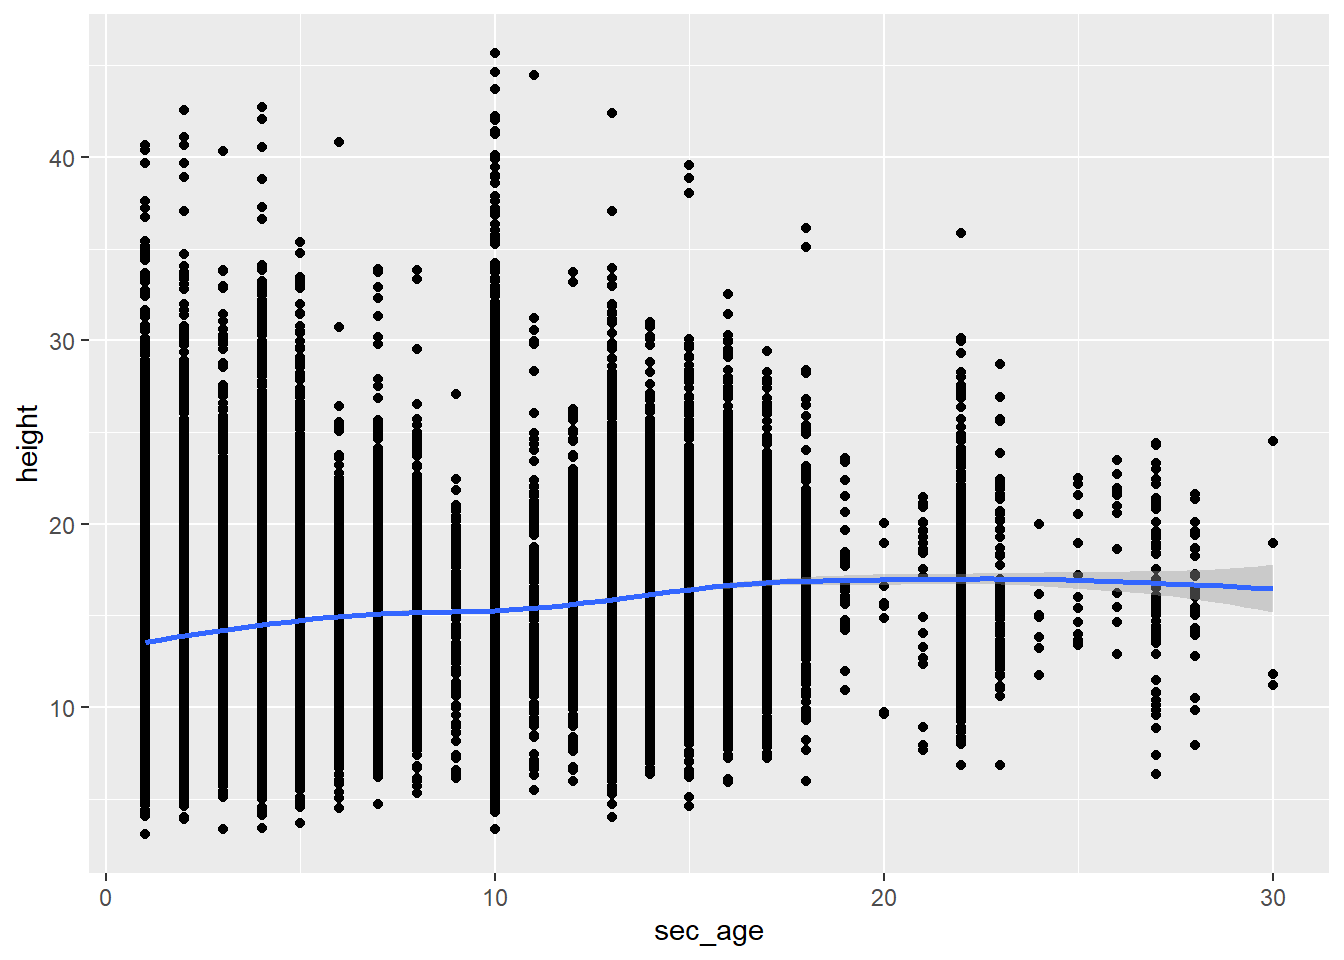
df_height |>
  subset(!is.na(sec_age)) |>
  ggplot(aes(sec_age, height))+
  geom_point()+
  geom_smooth()